Should we follow The Science or the Yellow Brick Road? (episode 3)

Study 6: Moderate consumption of alcohol confers no benefit whatsoever (OR, How even one drop of a drink takes you one step closer to the grave)
This one might just win the study of all studies award, because it’s actually a study of 3,248 studies, all on the topic of alcohol and your health. Not that meta-analyses are so unusual, but this study was exceptional because instead of analyzing all those thousands of studies, the researchers discounted all of them, except 6, and then presented their conclusion with a grand flourish and no embarrassment whatsoever.
The study was published in the Journal of Studies on Alcohol and Drugs and its results were picked up by 88 news outlets. Coincidentally, the name of the journal, JSAD, gives the game away. It’s all about disproving the J-curve, which these researchers seem pretty sad about.
Just what is a J-curve?
Brought to you by the letter ‘J’
J-curves can be plotted on graphs, but they’re not the tidy-looking graphs that we learn how to plot in high school. Scientists in general tend to prefer straight lines on graphs which describe things that are easy to understand, such as: the more fabric you pile on your face, the less likely it is you’ll get COVID; or, the more reluctant you are to get jabbed, the more likely you are to be involved in a car crash (even if you’re not actually driving the vehicle — see Yellow Brick Road, episode 2).
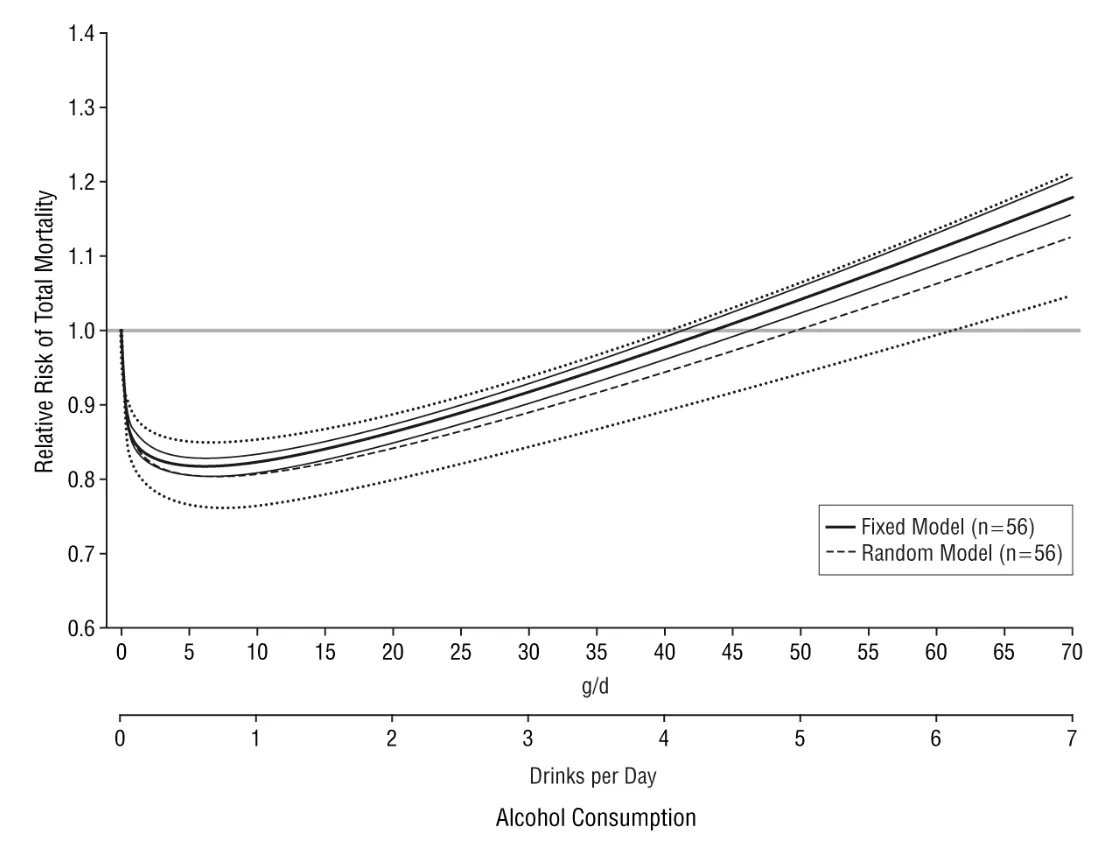
The J-curve is annoying to simple-minded scientists because, like the letter J, it goes down and then comes up again, eventually soaring to higher than where it started out. For quite a few decades, however, almost all of the thousands of studies coming out on alcohol drinking and health, particularly cardiovascular health, have shown a J-curve effect. That is, no drinking at all is okay for your heart, moderate drinking (variously defined but within similar parameters) is better for your heart, while lots of drinking is very bad.
Here's a nice J-curve from the Di Castelnuovo meta-analysis (here):
When Meta isn’t quite as Meta as you thought
Tim Stockwell, PhD, has long been an anti-J-curve crusader. He has previously succeeded in having his research published in JAMA, the Journal of the American Medical Association — that was back in 2023 — with a study titled, Association Between Daily Alcohol Intake and Risk of All-Cause Mortality: A Systematic Review and Meta-analyses.
According to the researchers (Stockwell and friends), this piece of science is a “systematic review and meta-analysis of 107 cohort studies involving more than 4.8 million participants, which sounds quite impressive, until you open up the “supplementary materials” attached to the JAMA article and discover this:

Stockwell and his colleagues actually started out with 3,248 studies, but managed to knock out 3,125 as invalid for their purposes, for a variety of reasons. One may conclude either that researchers do thousands of useless studies, or that Stockwell has some other reason for disliking all the studies he eliminated (or both).
Now they were left with just 210 studies, but that was still too many. So they knocked out another 103, some for lack of clarity in reporting how much people were really drinking, others for “not reporting outcomes for diseases of interest,” even though what they were investigating was all-cause mortality, not any specific disease.
Now they were left with 107 studies.
Fixing the scale
The next step was to weight the studies:
All analyses were weighted by the inverse of the estimated variance of the natural log relative risk. Variance was estimated from reported standard errors, confidence intervals, or number of deaths. The weights for each individual study were created using the inverse variance weight scheme and used in mixed regression analysis to get maximum precision for the main results of the meta-analysis.
That probably means something scientific to real scientists like Stockwell. What it means to regular people is that they decided which studies were more important, multiplied their results by unknown factors when making their calculations, and came up with the answers they wanted.
And so they wound up with the conclusion that,
This updated meta-analysis did not find significantly reduced risk of all-cause mortality associated with low-volume alcohol consumption after adjusting for potential confounding effects of influential study characteristics. Future longitudinal studies in this field should attempt to minimize lifetime selection biases by not including former and occasional drinkers in the reference group, and by using younger cohorts (i.e., age distributions that are more representative of drinkers in the general population) at baseline [emphasis added].
What’s 2 + 2? It depends on your method of calculation
There are several problems with their conclusion, and they’re quite obvious, but not if you only read the study’s abstract rather than the entire text. The abstract only says,
... daily low or moderate alcohol intake was not significantly associated with all-cause mortality risk, while increased risk was evident at higher consumption levels, starting at lower levels for women than men.
Nothing there about “adjusting for potential confounding effects of influential study characteristics.” Which characteristics were they talking about?
The analyses adjusted for the potential confounding effects of study characteristics including the median age and sex distribution of study samples, drinker biases, country where a study was conducted, follow-up years and presence or absence of confounders... and other prespecified study-level quality criteria.
The researchers add that they also,
... assessed publication bias, heterogeneity, and confounding of covariates that might potentially affect the association of interest using several statistical approaches... [emphasis added]
There are actually lots of ways to analyze data. If you don’t like what happens when you use one approach (such as linear regression) you can choose another one (such as Bayesian statistics) and get a different set of results.
Do all quitters go to A Anon?
But even after finding what he had started out looking for, Stockwell still wasn’t entirely happy, complaining that “sick quitters” tended to mess up the statistics if researchers weren’t careful. In fact, researchers were so careless about these sick quitters that only 21 out of the 107 studies were free of this particular bias.
Of 107 studies identified, 86 included former drinkers and/or occasional drinkers in the abstainer reference group, and only 21 were free of both these abstainer biases.
The problem with sick quitters, he explained, is that they “cut down or stop [drinking] for health reasons” and are then lumped together with abstainers in study results, making abstainers look worse than they should. To back up his assertion that this phenomenon is considerable and should be taken into account, he brings as evidence a study that he, himself, conducted back in 2016. In his description of the study in JAMA, Stockwell claimed that the 54 studies in his meta-analysis (whittled down from thousands, as he appears fond of doing) show,
... negligible reductions in mortality risk with low-volume alcohol use when study-level controls were introduced for potential bias and confounding, such as the widespread practice of misclassifying former drinkers and/or current occasional drinkers as abstainers.
In other words, eliminating the influence of sick quitters was only one of the confounding factors.
Another problem with the “sick quitters” theory is that it could equally apply in the other direction. Who says all former alcoholics become abstainers? Maybe they cut down on their drinking and become moderate drinkers, making that group of people seem sicker than they would otherwise. This doesn’t seem to have occurred to Stockwell.
But let’s suppose he’s right. Let’s suppose only 21 out of thousands of studies on the health effects of moderate drinking are valid. Let’s take a look at those 21 studies. 15 of the 21 support the J-curve (as this article summarizes). Only 5 do not, while 1 is inconclusive. Nonetheless, Stockwell’s study claimed that when sick quitters are taken out of the picture, there’s no benefit to be shown from moderate drinking. It’s not at all clear how he reached this conclusion.
Moderate drinkers are healthier — but that’s got nothing to do with drinking
A year passed, and Stockwell was back with a new study (the JSAD one). After all, as he writes,
... mounting evidence suggests these associations [of moderate drink with cardiac health] might be due to systematic biases that affect many studies. For example, light and moderate drinkers are systematically healthier than current abstainers on a range of health indicators unlikely to be associated with alcohol use e.g., dental hygiene, exercise routines, diet, weight, income; lifetime abstainers may be systematically biased toward poorer health... [emphasis added]
By “current abstainers,” Stockwell doesn’t only mean “sick quitters,” so it’s interesting to learn that studies (including ones not authored by Stockwell) have shown that moderate drinkers are in general healthier than non-drinkers.
Stockwell also mentions another drawback to many studies linking moderate alcohol consumption with better health:
... most studies have nonrepresentative samples leading to an overrepresentation of older White men.
No source for this allegation is provided.
Science!
As with his past research, Stockwell acknowledged that “all analyses were weighted by the inverse of the estimated variance of the natural log RR. Variance was estimated from reported standard errors, confidence intervals, or number of deaths. The weights for each individual study were created using the inverse variance weight scheme and used in mixed regression analysis to get maximum precision for the main results of the meta-analysis” [emphasis added].
That is to say: 1 estimate + 1 estimate + 1 creation = “maximum precision.”
This JSAD study started out with the same 3,248 studies the JAMA study featured. Stockwell and friends then whittled them down to 107 studies, just like before.
Then they started to look for the reasons why some studies showed a benefit for moderate drinking. They found that results came from,
... studies that (a) used younger cohorts, (b) excluded potential participants with current or prior ill health, (c) assessed alcohol use over less than 30 days, (d) did not suffer from abstainer bias in the reference group, (e) did not control for smoking status, and (f) did not control for SES [socio-economic status].
And with all possible bias removed...
Controlling for smoking status and SES is almost universal, Stockwell notes, because it is so widely accepted that smoking and being poor are bad for your health. So he has a bright idea: Perhaps future studies into the effects of alcohol consumption should stop adjusting for smoking status, because when he tried that himself, moderate drinking seemed to lose its benefits.
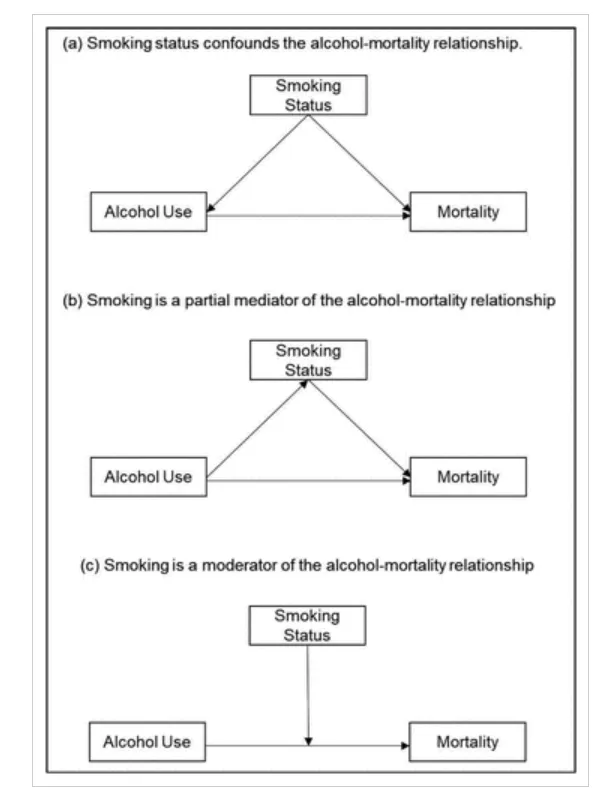
Maybe, he suggests, smoking removes some of the harmful effects of drinking? Nonetheless, perhaps because it wouldn’t look good to only use smokers to prove his point, Stockwell takes a look at poor people, and finds that while studies that control for SES show a benefit for moderate drinking, so do studies that don’t (although the effect is smaller).

There weren’t many confounding factors left, but being a persistent type of researcher, Stockwell was determined to get rid of all of them. It was a step-by-step process, because (even though he had managed to jiggle the data enough to get the right result for JAMA) moderate drinking was still looking good. It was only when every single confounding factor was gone and there were just 6 studies left (out of 3,248) that the results tipped. (Then Stockwell removed another study because its “quantity-frequency measure” wasn’t good enough, and was even happier with the result.)

So there you go. When your teetotal friends tell you that even one little drink to celebrate the Presidential inauguration this winter is bad for your health, you can show them this article. (And never trust JAMA or JSAD again.)
Stay tuned for the next episode of the Yellow Brick Road...


.webp)